
Budget @HOME. Make it work
10 Dec 2020 | | or@home or budget optimization bank data ipywidgets interactive jupyter notebook widgetsOnly last step is left: to combine all the components in one Jupyter notebook based app. We would like to have it interactive, and in this part, we will see how we can do that in Jupyter. It allows to quickly prototype a simplistic interface and also showcases a nice type of notebooks, which you can share with your stakeholders, without them running away from the look of all the python code.
Preparation
The core of our simplistic UI will be ipywidgets. These widgets will allow us to create buttons and sliders, and also connect them to the necessary code snippets.
We start with preparing our data. Here we generate artificial data (or use the real one), prepare it, define transaction importance factors, and filter for a specific year. That’s all that we have done in the previous posts of this series.
importance_factors = {"grocery":1, "fashion":2, "shopping":3, "travel":10, "rent": 1000, "unknown":10, "income":0}
transactions = generate_transaction_data()
prepare_data(transactions)
year = 2019
selected_year = transactions[transactions['year']==year].copy()
selected_year["importance"] = selected_year['type'].map(importance_factors)
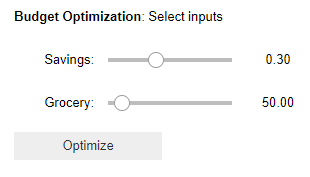
We would like to create three elements of the UI:
- Slider, which allows choosing the percentage of savings which we want to achieve
- Slider, which determines how much we would like to put aside each week for grocery shopping at a minimum
- Optimize button
Sliders and buttons
Lets do it one by one. First we define savings slider, which should deliver float values from in range [0,0.8] with a step of 0.05 and default value of 0.3 (30%).
savings_slider = widgets.FloatSlider( min=0,
    max=0.8,
    step=0.05,
    description='Savings:',
    value=0.3)
Grocery slider specifies amount in EUR to put aside for weekly grocery shopping:
grocery_slider = widgets.FloatSlider( min=0,
    max=500.0,
    step=5.00,
    description='Grocery:',
    value=50.0)
And finally the button:
btn = widgets.Button(description='Optimize')
Great! Now we need to display all elements:
display(savings_slider,grocery_slider)
display(btn)
and to link an action to the button click. For this we create an event handler method, which starts from clearing output of the previous optimization:
def btn_optimize_eventhandler(obj):
    clear_output()
Since the output is cleared, we need to re-display the widgets. It is like refreshing a web page. Plus we would like to get the values in sliders from our UI:
display(text, savings_slider,grocery_slider,btn)
savings = savings_slider.value
grocery_per_week = grocery_slider.value
And now we know what to do. We should create a model, solve it, parse results and provide the visualization!
model, variables = create_model(selected_year, savings, grocery_per_week)
status = model.solve()
if LpStatus[status] == 'Optimal':
    print("Optimization was successful")
else:
    valid = widgets.Valid(
        value=False,
        description='Infeasible'        )
    display(valid)
    print("Optimization was unsuccessful. Consider adjusting inputs")
    return

solution, objective = parse_solution(selected_year,variables,model)
solved_data = selected_year.join(solution)
remained_transactions_sum = sum(solved_data['solution']*solved_data['Debit'])
print(f"Total expenses of proposed retroactive plan: {remained_transactions_sum} EUR")
plot_solution_preview(solved_data)
obj.value = solved_data, out
Few tricks on top
Well, it is largely done! Every time we click on optimize button, user inputs from sliders will be taken, a new model will be generated and solved, and a corresponding visualization preview will appear. Can we do a bit better?
Yes, we can do 2 minor improvements on top, to make this notebook looking more like a web app. The first thing we will do is a detailed visualization of the saving plan. A user can have a brief overview after optimization, but if the plan makes sense, they can inspect a more detailed view. For this we will create a new button, appearing after optimization is done, which allows open/close detailed preview. This part is a bit trickier than the previous view generation since we need to generate a new output object, and clear only this output object, not wipe out optimization results and plan preview.
Let’s take a closer look. We make to extra buttons, one for more details, and the other one for closing (clearing) these details.
btn_analysis = widgets.Button(description='More details')
btn_close_analysis = widgets.Button(description='Close details')
We also need to modify the previously created method and add the following lines to create a new output object, in which additional visualization would be displayed, and which we can later safely clear:
out = widgets.Output()
display(out)
with out:
    display(btn_analysis)
Now about events for 2 new buttons:
def btn_analysis_eventhandler(obj):
    grocery_per_week = grocery_slider.value
    with btn.value[1]:
        clear_output()
        display(btn_close_analysis)
        visualize_solution_data(btn.value[0], grocery_per_week)

def btn_close_eventhandler(obj):
    with btn.value[1]:
        clear_output()
        display(btn_analysis)
The first one (show “More details”) is clearing output, plotting new visualization, and displaying the “close analysis” button. The second one just clears the output again and renders the “More Details” button.
The last detail is all this bunch of code in our notebook. A user would not be happy to see a lot of code, which he didn’t understand mixed with UI widgets. We can hide it. Here is a code snippet that I often use for this purpose:
from IPython.display import HTML

HTML('''<script>
code_show=true;
function code_toggle() {
 if (code_show){
 $('div.input').hide();
 } else {
 $('div.input').show();
 }
 code_show = !code_show
}
$( document ).ready(code_toggle);
</script>
<form action="javascript:code_toggle()"><input type="submit" value="Click here to toggle on/off the raw code."></form>''')
This snippet allows showing/hiding the notebook’s code with a click on the corresponding button.
Done! Our notebook looks now like a simplistic web-app, with the interactive interface:
Code
This code can be found in repository