
Budget @HOME. Introduction
22 Nov 2020 | | or@home or optimization operations research budget optimization bank accountI was once analyzing my bank account spendings. My bank UI was not very convenient: I cannot easily filter on interesting fields, some visualization were lacking, etc. But was there is an “export as .csv” button, which came quite handy. I decided to look at my expenses through my favorite tools.
 Photo by Morgan Housel on Unsplash
I can do whatever I want with my data! I started looking where I could have avoided spending too much money and then an idea came to my mind: this can be treated as a very simple optimization problem! So here it is: Budget optimization @HOME
What is the problem?
My bank account transactions contain a bunch of data. I would like to be able to understand easily what I’ve spent the most during the past period of time. Besides, I would like to retroactively optimize my expenses, i.e. answer a question: if I wanted to save X Euros in the past year, what things should I have avoided buying?
What is the data?
I use the data which my bank account allows to export as CSV. I suppose that many banks do so. For obvious reasons, I will show here only artificial data, created with a data generator (code provided). This data has exactly the same shape as my bank account data, and its format most likely bears strong similarities with other banks. That’s how it looks like:
| Beneficiary / Originator | Payment Detils | Debit | Credit | Booking date | Currency |
|---|---|---|---|---|---|
| Lidl 1245… | NaN | -60.0 | NaN | 09/12/2019 | EUR |
| Zalando Payments GmbH.. | NaN | -45.0 | NaN | 09/12/2019 | EUR |
| NaN | AMAZON EU … | -125.0 | NaN | 09/12/2019 | EUR |
Challenge
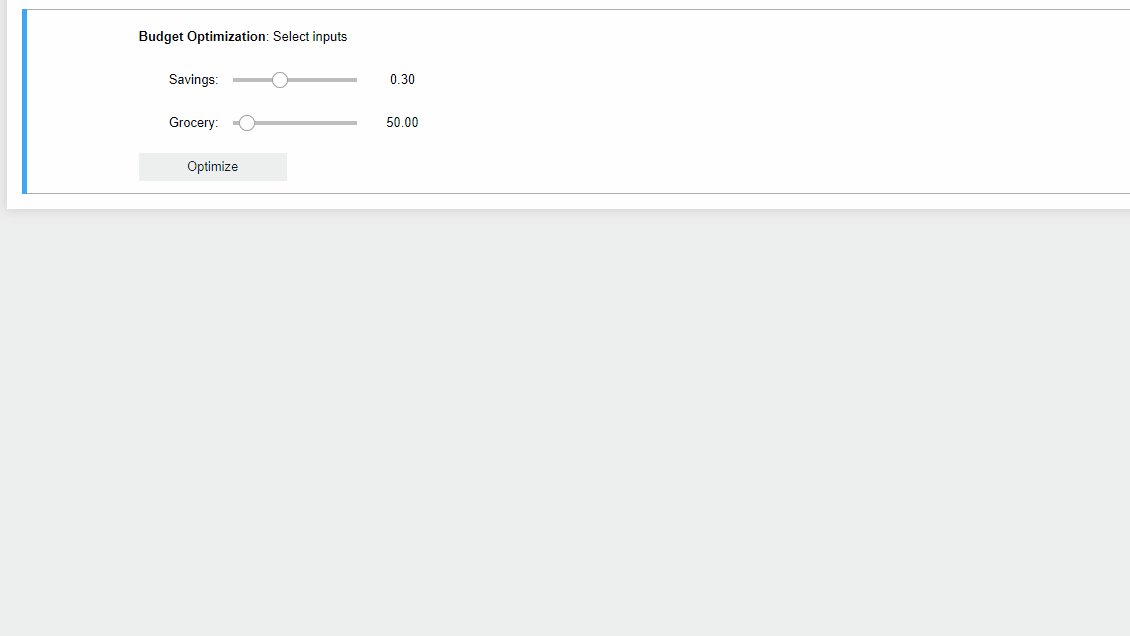
Our ambition is to build (step by step) something interactive, which can already be considered as a very basic app. We will keep things simple, we will not deploy anything, but rather consider it to be a simple Jupyter notebook based application. Sneak preview:
Tech stack
We will use the following languages/libs:
- Python
- pandas, numpy for data preparation
- plotly for data visualization
- pulp/cbc for optimization part
- jupyter, iwidgets for the interactive part