07 Feb 2021
|
Author: Vladimir Fux
|
or
budget
testing
hypothesis
property-based testing
optimization
knapsack
Sometimes you start with a simple optimization model, and then you are asked to add more and more features and constraints. Sometimes you venture into complicated modeling from the very beginning when it is not always even clear how different constraints will interact with each other.
But in any case, you want to make sure that your model is correct, that your solution satisfies customer requirements with any valid data input. How? Obviously by testing it. However usual unit-testing approach will most likely fail here.
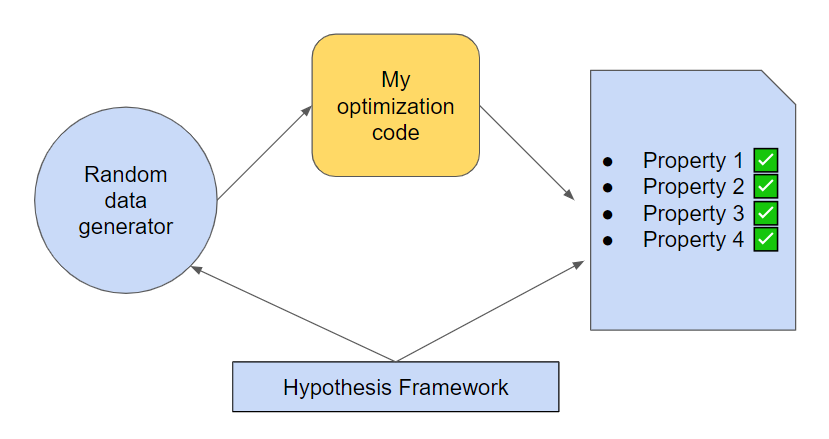
In this article, we talk about an efficient and simple way to test optimization models, which was introduced to me by my colleague Torsten.
More specifically, I will talk about the Hypothesis framework which can be used for any type of code, and exceptionally well fits Operations Research testing needs. Let’s start!
10 Dec 2020
|
Author: Vladimir Fux
|
or@home
or
budget optimization
bank
data
ipywidgets
interactive
jupyter
notebook
widgets
Only last step is left: to combine all the components in one Jupyter notebook based app. We would like to have it interactive, and in this part, we will see how we can do that in Jupyter. It allows to quickly prototype a simplistic interface and also showcases a nice type of notebooks, which you can share with your stakeholders, without them running away from the look of all the python code.
09 Dec 2020
|
Author: Vladimir Fux
|
or@home
or
budget optimization
bank
data
pulp
cbc
optimization
In this part, we create the “business logic” of our basic app. We would like to retroactively analyze our past spendings and to select transactions, which we need to cut in order to achieve a certain savings level. Under the hood, we will have a small optimization problem, which we solve with an open-source solver. Note, that this problem can be solved in multiple ways, and probably one can write a simple deterministic algorithm to find the optimal solution. However, our usage of MIP solver makes the approach extendable: we can easily add additional rules for optimization without making major changes to the algorithm. Let’s take a look!
26 Nov 2020
|
Author: Vladimir Fux
|
or@home
or
budget optimization
bank
data
visualization
plotly
In this part we visualize bank transactions data, aiming to get an idea
- Types of expenses and there share
- Savings trends
- Expenses by months and types
Just to understand what do we spend money on, and where is potential for savings.
23 Nov 2020
|
Author: Vladimir Fux
|
or@home
or
optimization
operations research
budget optimization
bank
data
preparation
Not only Machine Learning, but also Operations Research projects quite often start with the data preparation step.
In this part, we explore our bank account data, prepare it and deal with the transaction classification.
This sunburst chart from plotly library is a sneak preview from the visualization part of this post series. Our task, for now, is to prepare data, in order to allow such type of visualizations and data explorations through plotting libraries.